Agentic Browsing is still early, but we are starting to see a clear pattern in the websites we test.
At ONIK, we monitor websites across several areas, including uptime, response time, performance, accessibility, SEO, best practices, and Agentic Browsing. That gives us a useful view into how websites are performing beyond a one-time audit or a single page speed test.
We have already written about what Agentic Browsing is, why Google Lighthouse now checks for it, and why it may push accessibility standards forward. This article is a little different. This one is about what we are seeing in the field.
Across the thousands of URLs monitored in ONIK, we reviewed the 7-day average Agentic Browsing scores to better understand how prepared websites are for AI agents and automated browsers. The results showed a clear gap.
The average Agentic Browsing score was only 40.7/100.
That gap is the story and also represents the biggest opportunity. It suggests that many websites may look fine through traditional testing, but still may not be easy for AI agents or automated browsers to understand, navigate, or interact with confidently.
Why this matters now
AI traffic is already here, and it is on the rise.
Cloudflare reported that AI crawlers represented about 20% of Verified Bot traffic in 2025, while search engine crawlers represented about 40%. Cloudflare also reported sustained growth in ChatGPT-User traffic, which is generated when ChatGPT visits pages in response to user requests.
Imperva reported that automated traffic surpassed human traffic in 2024, accounting for 51% of all web traffic, with bad bots making up 37%.
HUMAN Security reported that monthly AI-driven traffic grew 187% from January to December 2025, while traffic from AI agents and agentic browsers grew 7,851% year over year.
Those numbers are not all measuring the exact same thing. A crawler collecting content is different from an AI agent trying to complete a form, compare vendors, book an appointment, or check out on behalf of a user. But that distinction is exactly why this matters.
The web is not only being indexed anymore. It is increasingly being interpreted, summarized, navigated, and acted on by software. As that shift continues, website readiness will need to include more than speed, uptime, and traditional accessibility checks. It will also need to include whether an agent can understand what a page is, what actions are available, and how to complete them reliably.
What Agentic Browsing can do for a visitor
When people hear “AI agents,” it can sound abstract. But on a website, the use cases are practical.
An agent may read a site to find information, answer a question, or collect key details for a user. That could mean finding pricing, comparing service options, checking availability, summarizing a policy, or pulling together key information from a long page.
It may also complete simple interactions. An agent could use a search field, fill out a contact form, submit an expression of interest, or help a visitor find the right next step.
Over time, those interactions may become more complex. Agents may help users register for events, configure a service, purchase a product, submit a support ticket, update account information, or complete a multi-step workflow.
For that to work well, the website needs to provide more than content. It needs structure. It needs clear labels, predictable actions, understandable forms, and pages that communicate meaning in a way software can interpret.
That is where many websites are not ready yet.
The weakest category was Agentic Browsing
Across the thousands of URLs we reviewed, Agentic Browsing was the weakest category by a wide margin.
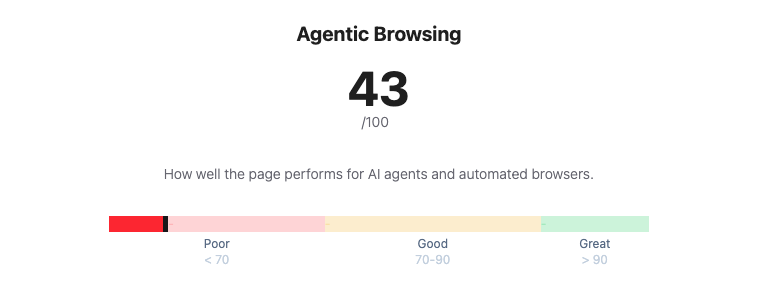
The average Agentic Browsing score was just 40.7. Looking deeper into the sample, over 70% of URLs tested had an Agentic Browsing score below 50. About two-thirds scored poorly, below 40, while less than 10% scored 70 or higher.
This does not mean those websites are broken. It does not mean they are slow. It does not mean they are unusable. It means that, when evaluated through an Agentic Browsing lens, many pages are not providing enough structure, clarity, or machine-readable context for agents to understand and interact with them confidently.
That is not especially surprising. Agentic Browsing is a newer category. Standards like WebMCP and llms.txt are still emerging, and most websites were not built with agent-driven browsing in mind. Still, the size of the gap is meaningful.
It shows that agent-readiness may become a separate layer of website quality, not something that can simply be assumed because a site already performs well elsewhere.
Strong scores do not always mean agent-ready
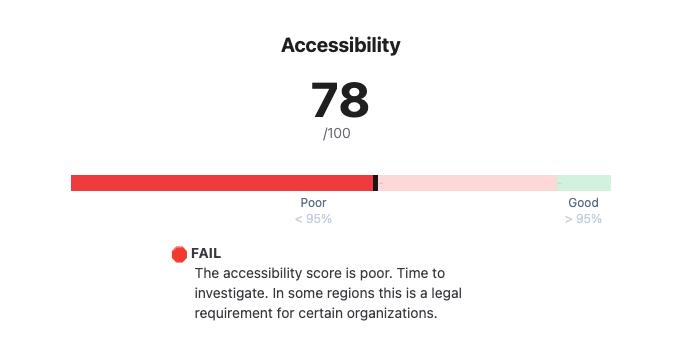
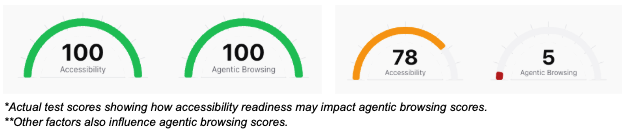
One of the more useful findings was that strong performance and accessibility scores did not always translate into strong Agentic Browsing scores.
We saw many pages with strong performance scores, strong accessibility scores, or both, that still scored poorly for Agentic Browsing. That is probably the strongest takeaway from this review: a website can be fast, accessible, and still be poorly prepared for agent-driven interaction.
That does not make the existing work less valuable. A fast, accessible website is still a better website. It simply shows that Agentic Browsing is adding a new layer to how website readiness should be evaluated.
Performance, accessibility, and agent-readiness are connected, but they are not the same thing. A page can load quickly and still be difficult for an automated browser to interpret. It may have unclear buttons, weak labels, non-semantic page elements, confusing form structures, or interactions that rely heavily on visual context.
We explored the connection between Agentic Browsing and accessibility in more detail in our earlier article on how Agentic Browsing may push accessibility standards forward. But the data shows the overlap is not complete. Agentic Browsing builds on performance and accessibility, while also exposing gaps those scores may not fully capture on their own.
What this means for website owners
For website owners and operators, this matters because AI agents are likely to become part of how users research services, compare options, complete forms, book appointments, make purchases, and interact with websites more generally.
Gartner has projected that by 2028, 33% of enterprise software applications will include agentic AI, up from less than 1% in 2024. It also predicts that at least 15% of day-to-day work decisions will be made autonomously through agentic AI by 2028.
That does not mean every website interaction is about to become agent-driven overnight. It does suggest that agents are moving from demos and experiments into the tools people use to get work done.
As that happens, websites will increasingly need to be understandable not only to people, but also to the systems acting on their behalf.
The practical takeaway is not that every website needs to chase every emerging AI standard immediately. The better starting point is to understand where your site may already be creating friction.
Are key pages structured clearly? Are forms properly labeled? Are buttons and links understandable without relying only on visual context? Does the page make its purpose clear in the structure of the site, not just in the design? Can an automated browser understand what actions are available and what step should come next?
These are not only agent questions. They are website quality questions. That is why we continue to come back to the idea that Agent-ready = Human-ready.
Next Steps
What we’re stoked about is making sites agent friendly ultimately makes them a better experience for humans. Here are some steps you can take to improve both.
- Sign-up to ONIK Scorecard to see your Agentic Browsing score, Insights, and Actions.
- Learn more about building agent-friendly websites, implementing llms.txt, and WebMCP